TOPALi was designed to provide visual methods of detecting recombination, and the primary form of representing this information is via result graphs. Each of the detection methods (see PDM, HMM, and DSS for further information), produces between 1 and 3 graphs per analysis run.
Although there are differences in these graphs in terms of the information they convey, working with them (and what you can do with them) is carried out in the same way regardless.
All analysis results are displayed within the main window in a new tabbed pane. In general, each pane will contain the following information:
The graphs will be scaled according to the data they contain. Moving the mouse over them will display the nucleotide position and the y value for the position under the cursor.
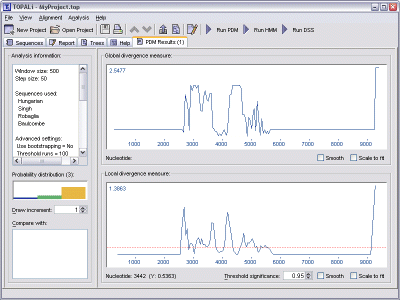
PDM generates two statistics - a global divergence measure, and a local divergence measure. Each is plotted in its own graph, with the global statistic appearing above the local.
A PDM Results pane also provides information on the probability distribution of the topologies found along the alignment. This information is displayed as a histogram on the left-hand side of the pane, and is updated as the mouse is moved over either of the graphs.
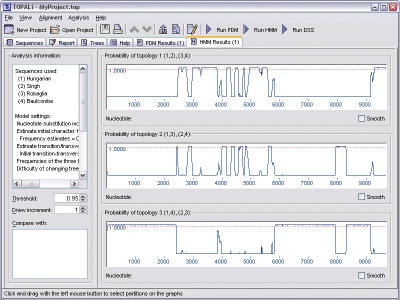
HMM generates three graphs, each one corresponding to the probability of one of the three possible tree topologies being the most dominant.
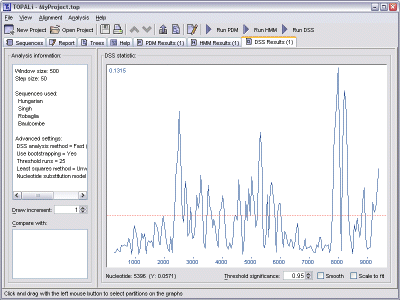
DSS generates just one graph, where each significant peak corresponds to a point where recombination may be occurring.
DSS is also capable of being run multiple times, generating multiple results. In this situation, a colour-coded list box is provided with the graph to map each result set back to the lines that have been plotted.
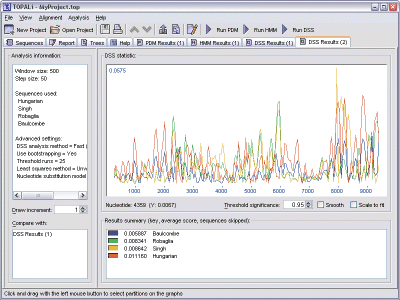
The sequences are listed within the box in ascending order of their DSS score, that is, the runs (while skipping a sequence) that created the lowest average DSS score will be listed nearer to the top.
To compare two or more sets of results (generated from the same analysis method), simply select the appropriate results from the Compare with list box.
Single clicking an entry with the mouse will compare the currently visible graphs with the graphs of the selected entry, whereas shift-clicking the mouse will allow multiple entries to be compared.
Note that the currently visible graph will always have its y axis scaled to the maximum value of its own data (or threshold), therefore if a comparison's graphs contain higher values they will not be visible. Viewing the results pane of these graphs instead and comparing back against the lower valued graphs overcomes this.
The following settings may be available for adjusting how the graphs and their threshold values look on screen. Note that not all settings are available for all graph types.
Graphs can be saved in one of three formats:
To save a graph, select File | Save Graph As from the menu bar, then choose the graph to be saved. Alternately, right-click the mouse directly on the graph to be saved and select Save Graph As from the popup menu that appears.
The Save Graph As dialog will then appear, allowing you to choose a location on disk for the graph, along with the data format to save it in.