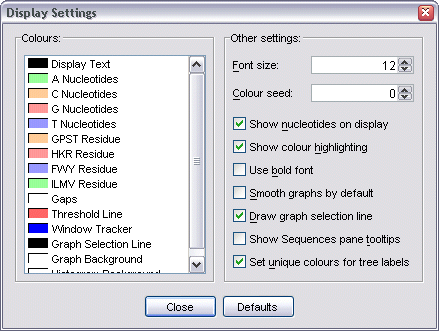
Display settings
A range of visual options can be customized by selecting
View | Display Settings from the menu bar,
right-clicking on any graph and selecting Display Settings
from the pop-up menu that appears, or by pressing F5. This brings up the
Display Settings dialog.
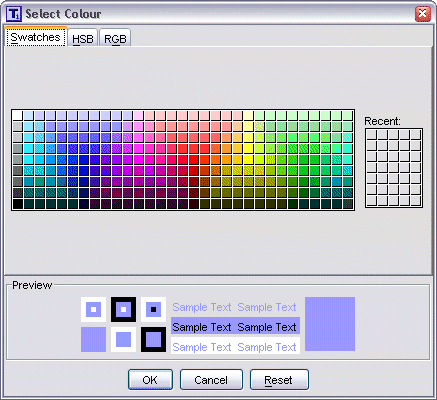
Customizing colours
To change the settings for colours, simply select a colour with the mouse.
This brings up a standard Colour Chooser dialog where you can then select a new
colour to use instead. Any changes made will take effect immediately, with the
main window updating to reflect the changes even while the
Display Settings dialog is visible.
Customizing other options
A range of additional options are also available:
- Font size - specifies the size used to draw nucleotide data.
- Colour seed - specifies the seed used to generate random colours
for graphs and histograms.
- Show nucleotides on display - toggle displaying nucleotide data on
the sequence display area.
- Show colour highlighting - toggle the highlighting of nucleotide
data with background colours.
- Use bold font - toggle displaying nucleotide data in a bold font.
- Smooth graphs by default - toggle using anti-aliasing to smooth
newly created graphs (off increases drawing. speed)
- Draw graph selection line - toggle drawing the graph selection line
(off increases drawing speed).
- Show Sequences pane tooltips - toogle showing sequence and
nucleotide information as a tooltip over the Sequences pane
- Set unique colours for tree labels - toggle drawing trees with
unique colours for every sequence label (off uses PAL defaults which colours
similar sequences with the same colour)